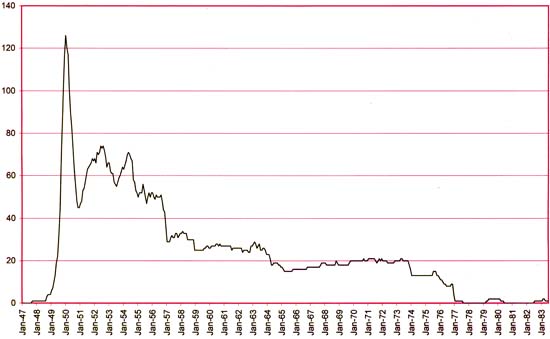
When I reviewed Michelle Nolan’s recent book, “Love on the Racks”, I mentioned that I sometimes had trouble keeping track of the numbers that she would cite to illustrate the ups and downs of romance comics. I therefore resolved to try to make a graphic presentation. I used the data collected by Dan Stevenson found in “All the Romance Comics Ever Published (?)”. As I previously described, what I have done was followed the time during which each romance title appeared and counted up the number of titles that could be expected to be out each month. Bimonthlies were treated as being out in the in-between months (it is not an unreasonable assumption that they would actually stayed on the racks for a couple of months).
Tracking the number of titles provides an indirect indication of the popularity of the romance genre over time. After all if a title sells well enough a publisher is likely to introduce a new one in the same genre, while if sales are poor the title is likely to be cancelled. Thus in such a free market the number of titles is a fair reflection of the popularity of romance comics. There is one important caveat to this statement and that has to do with response time. With comic books it took one to two months to prepare the art, a month for the printing, and another month for the distribution. Comic books were released on assignment and profits were based on the comics actually sold. The publisher would not know how well a particular issue sold for at least a couple of months, if not more. This means that by the time the first indications reached a publisher of how successful a new title was there already may have been as many as four issues released (assuming it is a monthly). Further a publisher might want to give a new title a chance to gain its audience so even further issues might be issued before a poorly selling title might be cancelled.
The lag between release of a new title and the cancellation if it sold poorly is the explanation for the love glut. I previously showed the graph just for the glut itself but the above chart for the entire history of romance comics puts it into a better perspective. The rapidness of the ascent, the height achieved, and the quickness of the decline are unmatched in any other period. Probably unmatched by any other comic book genre as well.
As interesting and distinct as the love glut is revealed in this graph, there are other features that call for explanation. Initially I thought to divide up the chart into three distinct periods. The first period would begin with the love glut and last until early in 1957. The ending for the second period is not as distinct but could be placed between 1963 and early 1965. The final period lasted until late 1977 when the romance genre disappeared. The two small blips (1979/80 and 1982/83) are nothing more then failed revival attempts.
Romance Titles for All Publishers
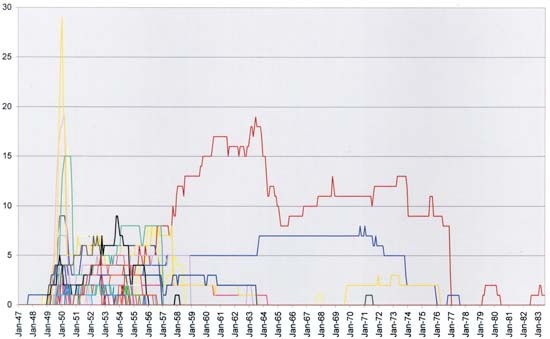
Different colors are used for the graphs of the individual publishers
I also plotted the number of romance titles for each publisher. Now the reader should not strain themselves trying to understand the ups and downs of the individual publishers. Even with a much larger image then the one I provide above I could never truly distinguish what was going on. This chart does reveal some interesting features. One is how distinct the love glut was even when broken down into the individual publishers. This is because of overzealous actions of four in particular (Timely, Fox, Fawcett and Quality) who combined contributed to about two thirds of the love glut.
Although part of the chart is pure confusion it becomes more understandable from 1957 on. Initially there were a lot of different publishers pursuing the romance comic market but after 1957 their number became drastically reduced. For much of the ending period there were only two or three publishers of romance comics. I will be returning to phenomena below where I will present another way of examining it.
Perhaps the most unusual feature of the chart is the dominance of one publisher from 1957 on. This publisher released romance titles at levels that was only exceeded by Timely, Fox, Fawcett and Quality during the love glut and at one point (1963) was only surpassed by Timely’s peak. Who was the successful publisher? Well it was Charlton. In a free market the number of romance title was supposed to reflect their popularity. Does this mean during the later period Charlton love comics became the most popular of the genre even more successful then any other publisher throughout the history of the romance comics? Not really. Charlton was unique among the romance publishers in that they printed their own comics as well. Charlton would actual save money by keeping the print press continually running. Therefore the company had an incentive to publish comics that had low profits providing they were not actually losing money. Unfortunately that means Charlton is not running under quite the same version of the free market that the other publishers who would be less willing to put effort into titles that produced low profit. Therefore Charlton distorts the picture provided by the first chart.
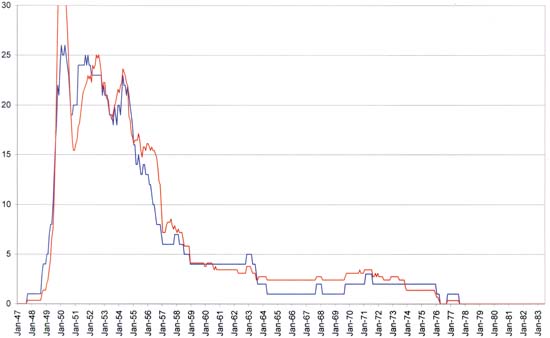
Romance Titles by Charlton and All Other Publishers
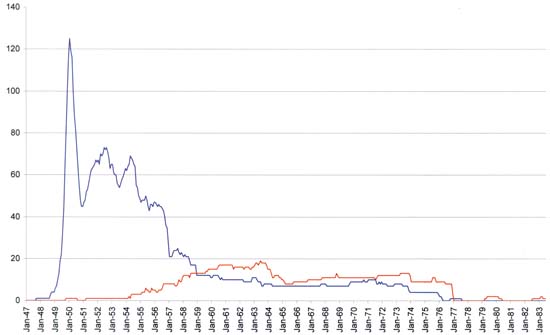
Charlton in red, all other publishers in blue
To judge how Charlton was distorting the data, I graphed Charlton separately from all other publishers. This graph shows that what I originally thought was a middle period was actually due to affects of one publisher, Charlton. It might be interesting to determine the meaning of Charlton’s downturn from 1963 to 1965 but that explanation would only enlighten Charlton’s history not to the history of romance comics in general. Therefore I now divide the history of love comics into two periods; an early or flourishing period and a final or waning period. The transition between the two periods is very sharp and that feature is unchanged whether the Charlton data is included or not.
The early period begins with the love glut and last until early in 1957. This is the heyday of romance comics. I would love to call it their golden age but that would only cause confusion as that term is often used among comics in general for an earlier period. It certainly was a good period for publishers of romance comics. Although we can see a lot of fluctuations in the number of titles there were about 50 toward the end of the prime period which is a respectable number for any genre. There are features in this period I would like to understand in particular the two mini-peaks that occurred after the love glut. Were they a similar, but more reduced, version of a phenomenon like the love glut? That is could they have been caused by publishers trying to cash into the popularity of romance comics, albeit with more caution then previously? Or was the popularity of romance comics at that time being influenced by something else as for example the general state of the economy (the trickle down effect)? At this time I have not drawn any conclusions on the matter but the subject deserves more investigation.
Romance Publishers and Titles
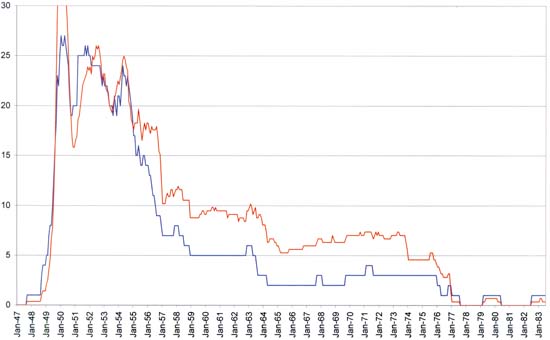
Number of romance publishers in blue, compared with a scaled version of the number of romance titles in red
When I charted the romance titles for each publisher (the second graph) there seemed to be a decline in the number of publishers at approximately the end of the flourishing period. Because that graph was much too confusing to make out the details I decided to chart the number of romance publishers which is shown just above. To help relate the variations in romance publishers to that of romance titles I included the romance titles graph scaled to approximately fit the chart of the romance publishers during the early period. As can be seen there is some good correspondence between the two charts. In particular both graphs show a rapid decline at the end of the flourishing period which terminates at the same February 1957 date. This is not too surprising because a free market affects both the number of publishers as well as the number of titles. Note however that when the number of romance titles was scaled to match the number of publishers during the flourishing period, there are proportionally more titles then publishers during the waning period. One explanation for this divergence is that those publishers who continued to do romance comics were able to increase the number of romance titles they released because of the decrease in the number of competing romance publishers. However remembering how Charlton’s desire to keep their presses running had distorted the romance title graph during the waning period I decided to compare the two graphs with Charlton removed.
Romance Publishers and Titles Excluding Charlton
Number of romance publishers in blue, compared with a scaled version of the number of romance titles in red
Once Charlton is removed from the picture, the graphs of the number of romance publishers and the scaled version of the number of titles has become remarkably similar. Thus the number of romance publishers and the number of love titles they released both seem to be subject to a free market and both are good indicators of the popularity of love comics.
Either of the charts, including or excluding Charlton, says pretty much the same thing. In the discussion below I will be using the graphs that include Charlton. The most interesting thing about the early period is the rapid decline that ended it. From a local high of 23 romance publishers with 70 titles at June 1954 the number of publishers steadily declined until February 1957 when there were only 7 romance publishers with a total of 29 titles. While the decline in romance publisher was continuous, the decline in titles hovered around the 50 titles mark for much of this period.
It was not just romance, instead there was a decline in comics of all genre at approximately this same time. I have heard two explanations for this. One is that the blame falls on the Comic Code. The idea being that with the heavy censuring of the comic code the quality of the stories declines and many readers lost interest and stopped buying comics. The problem with this explanation is that the Comic Code stamp started appearing on comics on or about March 1955. However the rapid decline had actually started many months before.
Another explanation advanced for the decline of comics of all genres is the rise of televisions. I have two problems with this explanation. One is this presumes that entertainment is a zero sum game. That is the audience for television could not grow without taking readership away from comics. I am not convinced that is true. Secondly the American public did not suddenly buy televisions. TV’s began to appear in the late ’40s however the public’s response was not immediate but was spread out over many years. The end of the prime period occurs over much too short a time to be due to the increased dominance of televisions. So I am unsatisfied with this explanation as well.
Is there any other candidate for the decline that started after June 1954? Well actually there was. June 1954 was the peak but that meant the actual first decline started in July. The dates I have been using are cover dates, which are actually a couple of months later then the true colander date of their release. So the first decline was really in May. April 23 and 23 marked the dates for the Kefauver Senate hearings about the supposed effect of comic books on the youth of America. But the Senate hearings did not come out of the blue; they were part of the response to the public outcry brought on by the book “Seduction of the Innocents” of Dr. Frederick Wertham. There were anti-comic sentiments prior to Wertham’s book, as shown in the recent book “The Ten Cent Plague” by David Hajdu. In fact Wertham had played a part in the earlier anti-comic feelings as well. But using his status as an expert (and without any real scientific evidence) Wertham and his book incited a reaction against comic books greater then ever seen before. As I said his book led to the Kefauver Senate hearings but it had an even more immediate result. There were newsstands and other sellers of comic books that began to refuse comics they considered objectionable. This decrease in sales in turn lead to the failure of the distributor Leading News which in turn lead to the decline of some comic publishers most importantly EC. A later result was the creation of the Comic Code Authority which only made matters worse. All of this started with “Seduction of the Innocent” so the ultimate case of the collapse of comic books can be traced to one supposed expert Dr. Frederick Wertham.
But what if there was no Wertham and “Seduction of the Innocents”? Well such questions can never be answered with complete assurance. Anti-comic sentiments did exist and there were other public figures to promote them. If the previous history of comic criticism was any example then there is no reason to believe that the publishers would ever been faced with much difficulty. What seemed to be needed to bring anti-comic feelings to a significant level was some spokesman like Wirtham. There is no way of knowing whether without Wirtham some other spokesman would have arisen. But it would seem that without Wirtham at least the timing would have been altered and history would have played out differently. How different cannot be guessed.
Another question is that if comics were a free market system, why did not the publishers remaining during the waning period just increase their number of romance titles to bring the number of titles up to levels more closely approximately that of the flourishing period? The answer to that is that not all publishers and their comic titles are alike. This should not be surprising as even today collectors tend to focus on particular comics. Readers were not satisfied to read any comic on the racks but each had their own favorite titles and publishers. When particular publishers disappeared their fans were less satisfied with what remained and less likely to switch to another publisher. The drop in story quality with the Comic Code did not help matters either.


